
Overview
.png&w=1080&q=75)
.png)
The Test feature enables users to execute their automation once to verify or test its functionality. During this process, the automation runs a single instance using a predefined hard-coded setup schema(if present). For example, an automation designed to fetch an object's metadata when tested will execute it and generate a result. The results from each test are stored for easy access and reference.
How to test your automation?
After creating an automation, navigate to the
Testsection.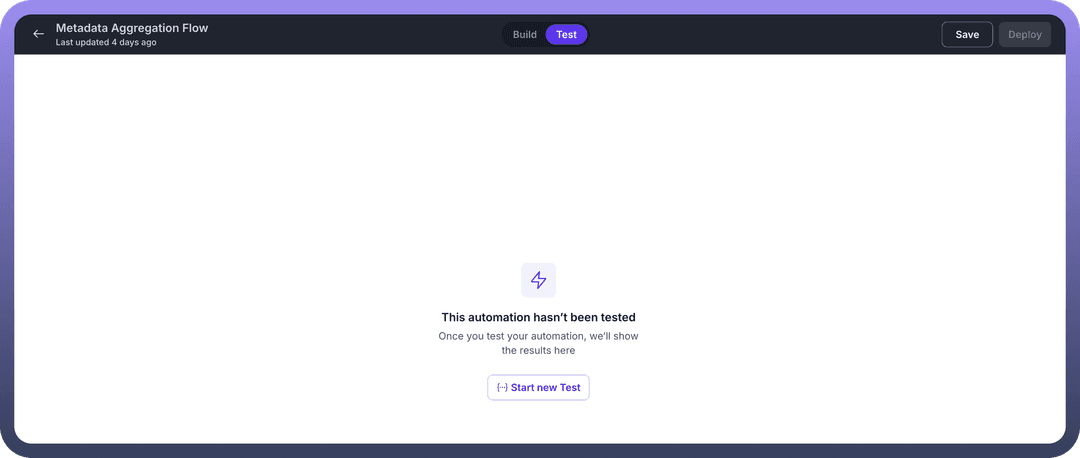
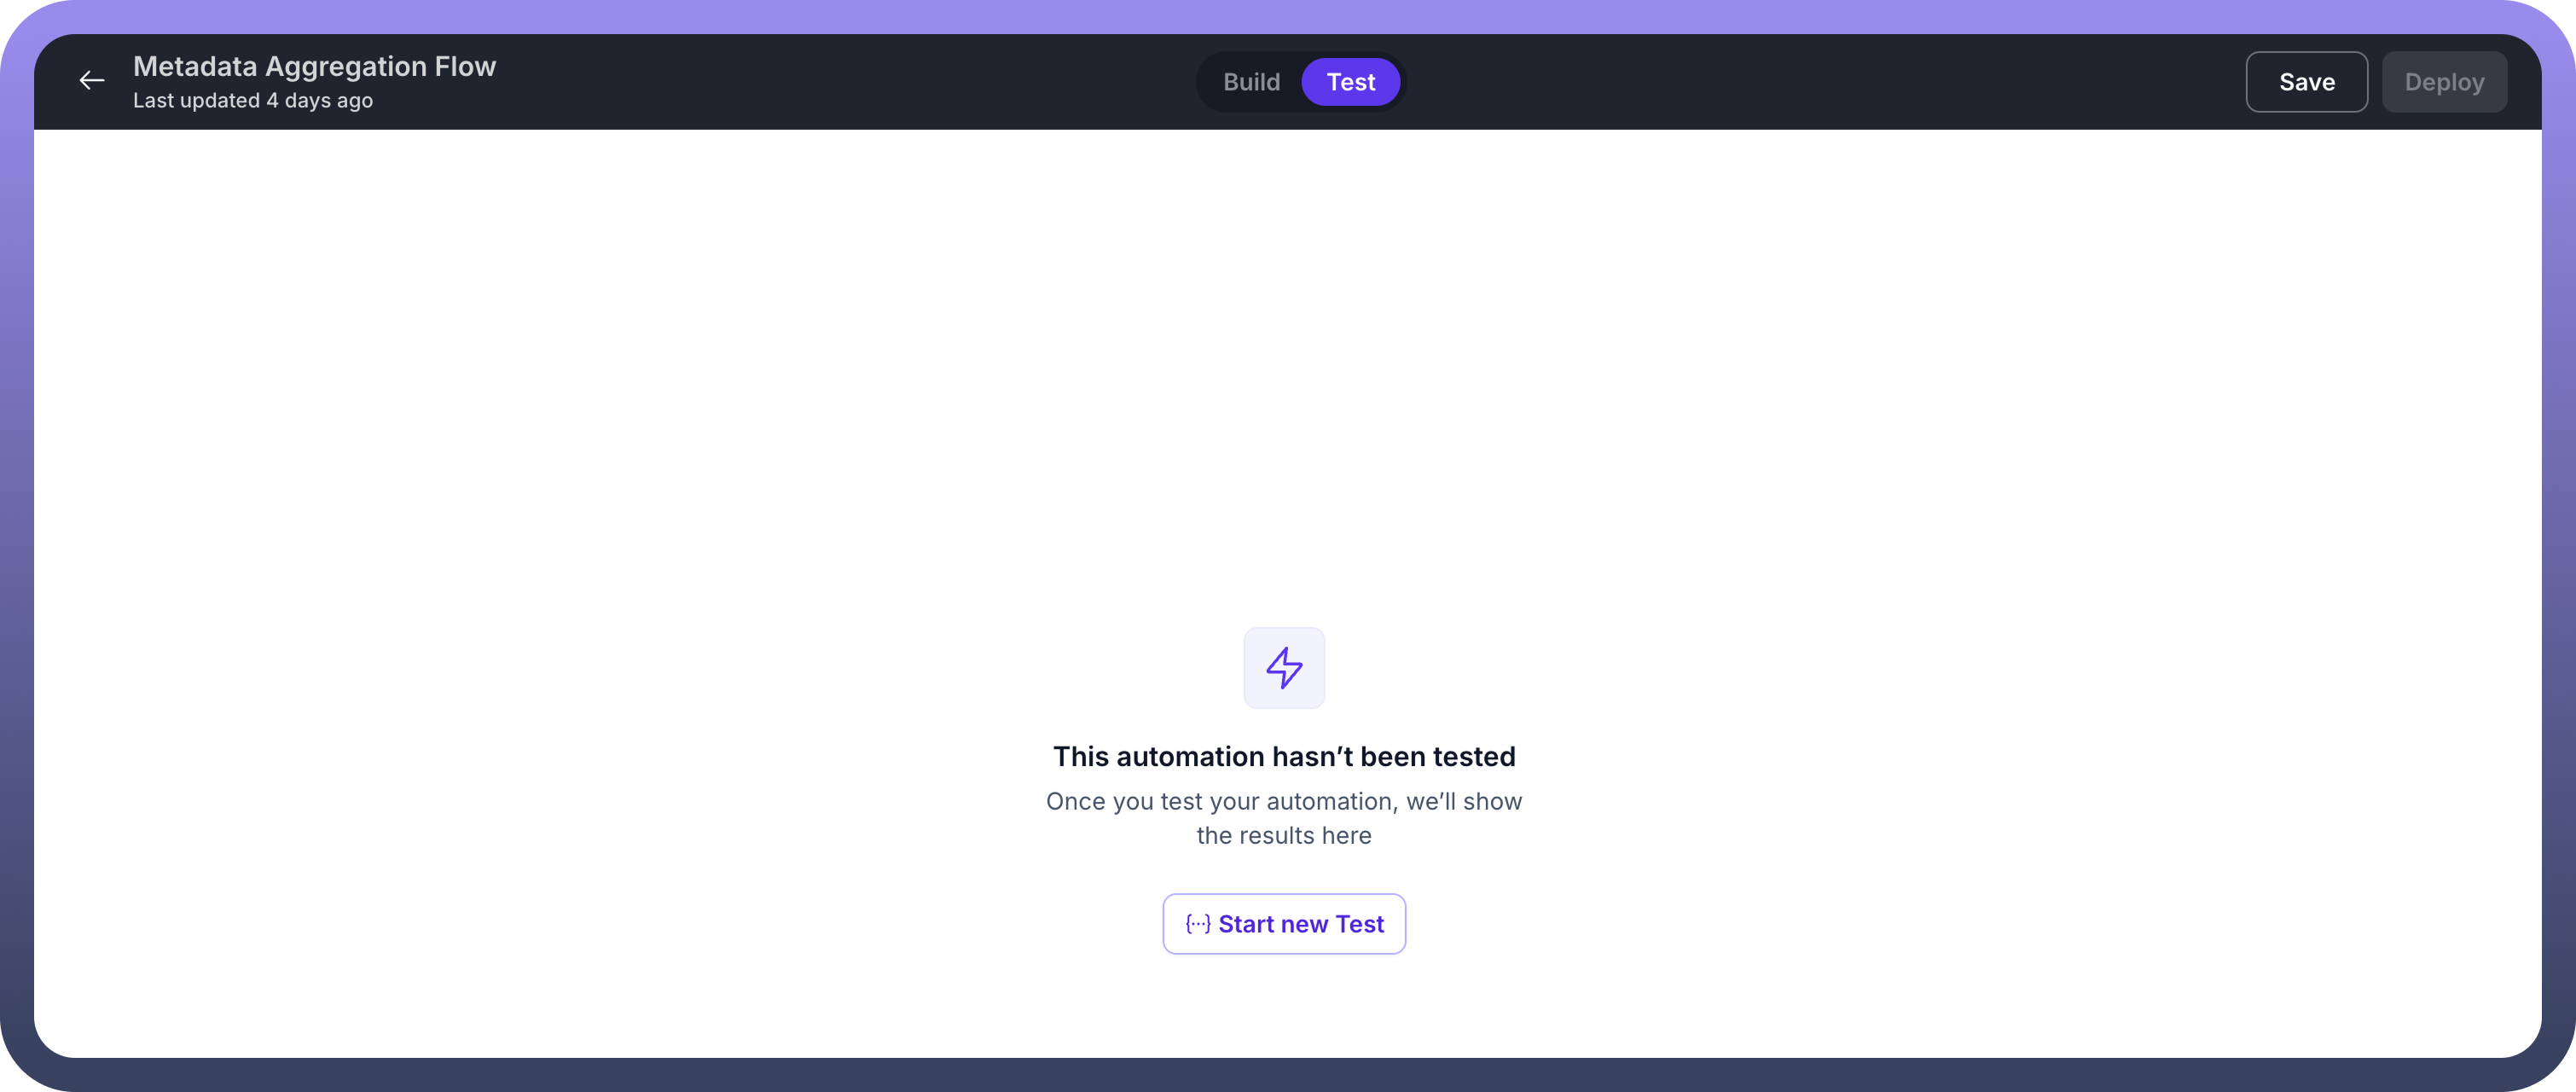
Click the
Start New Testbutton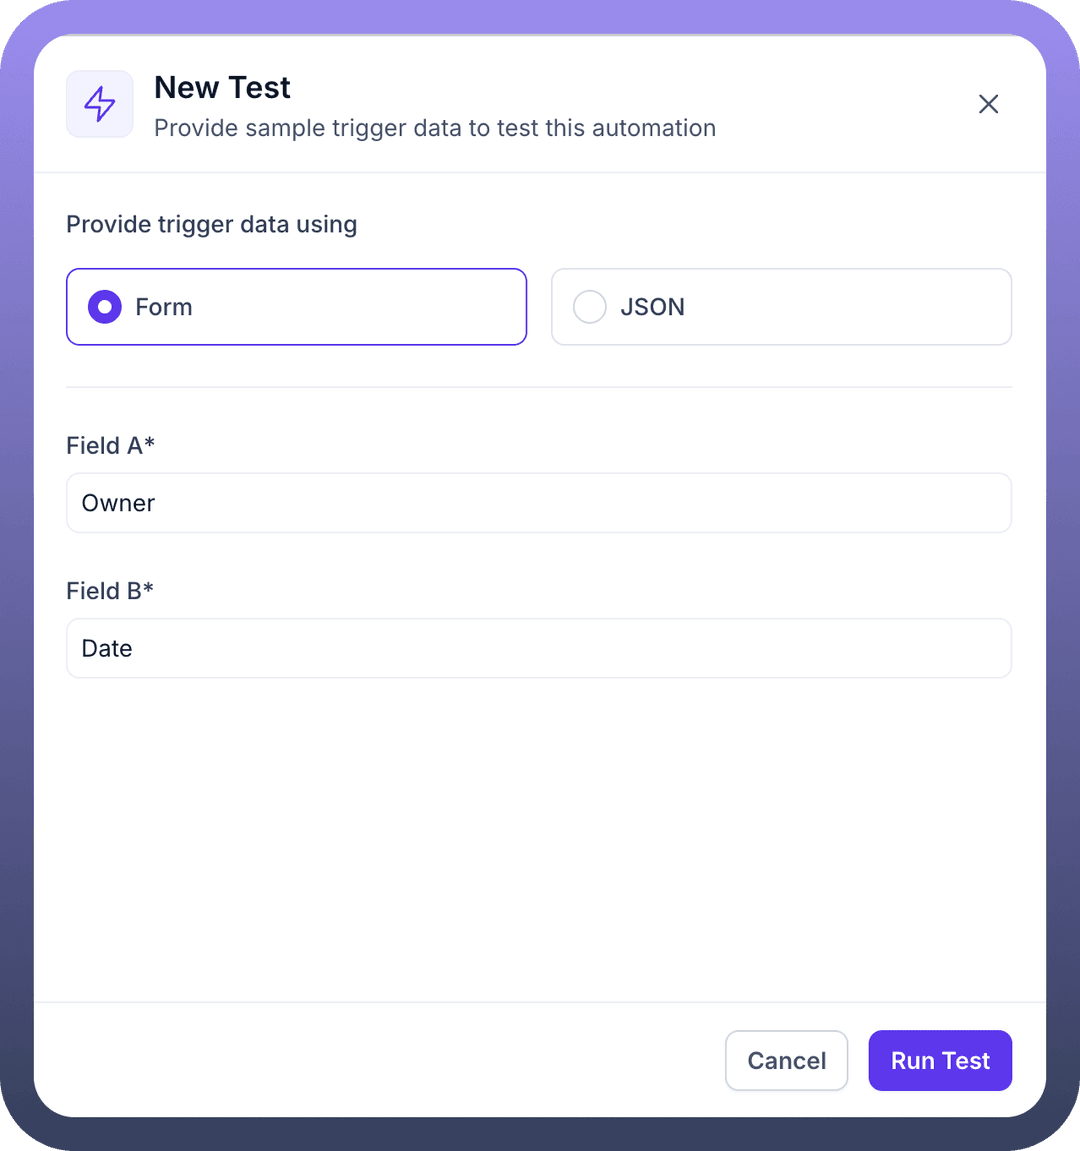
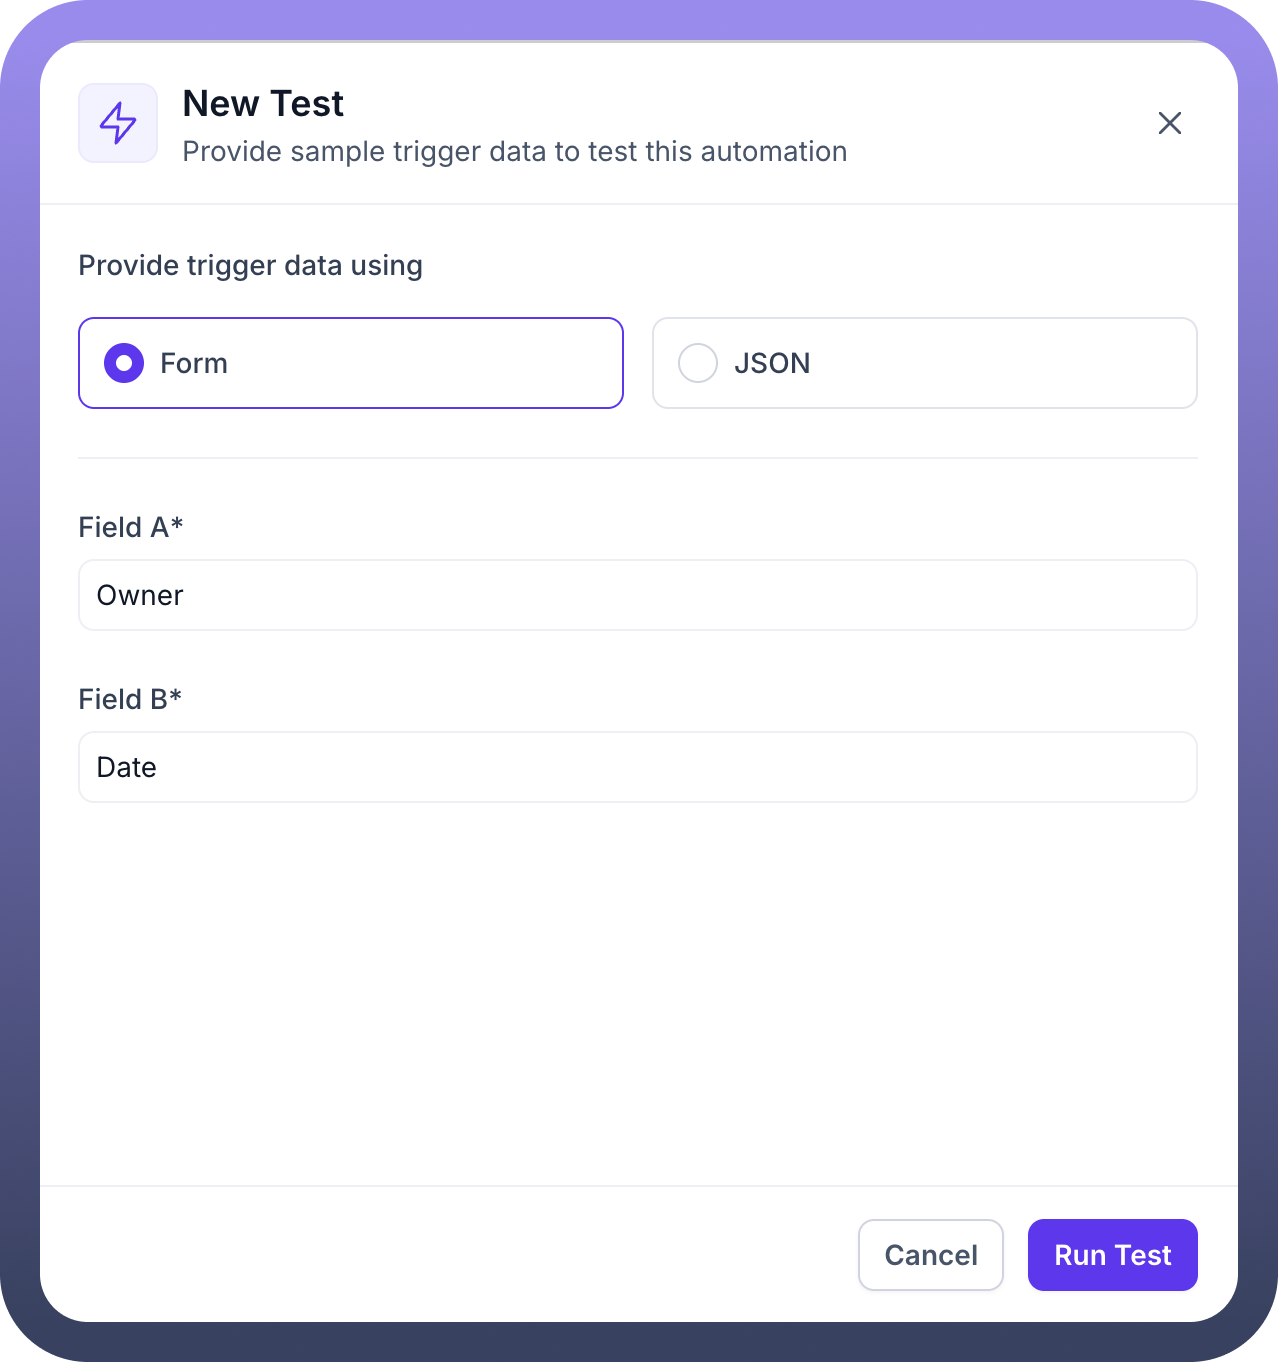
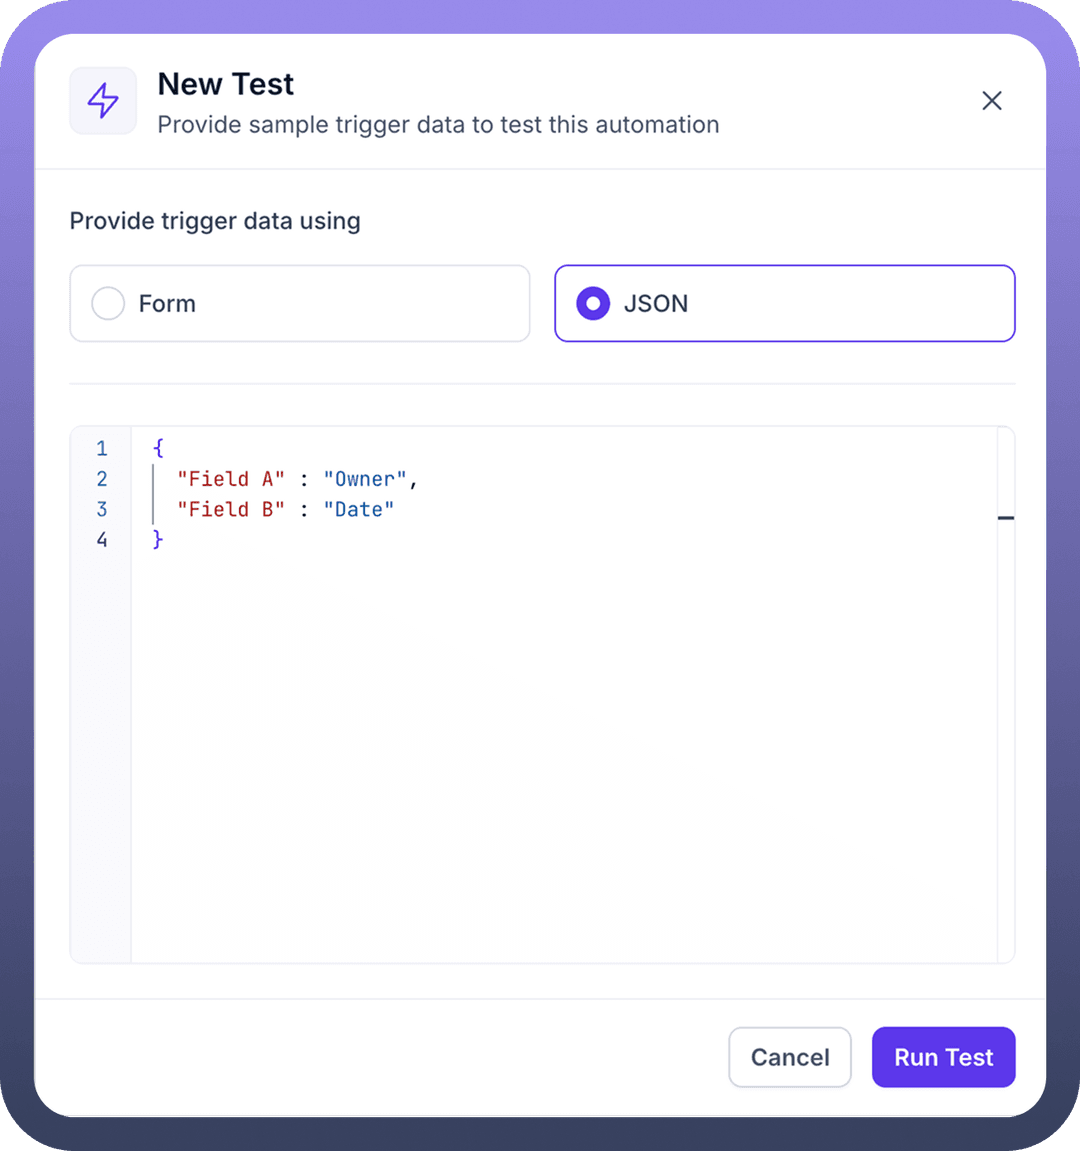
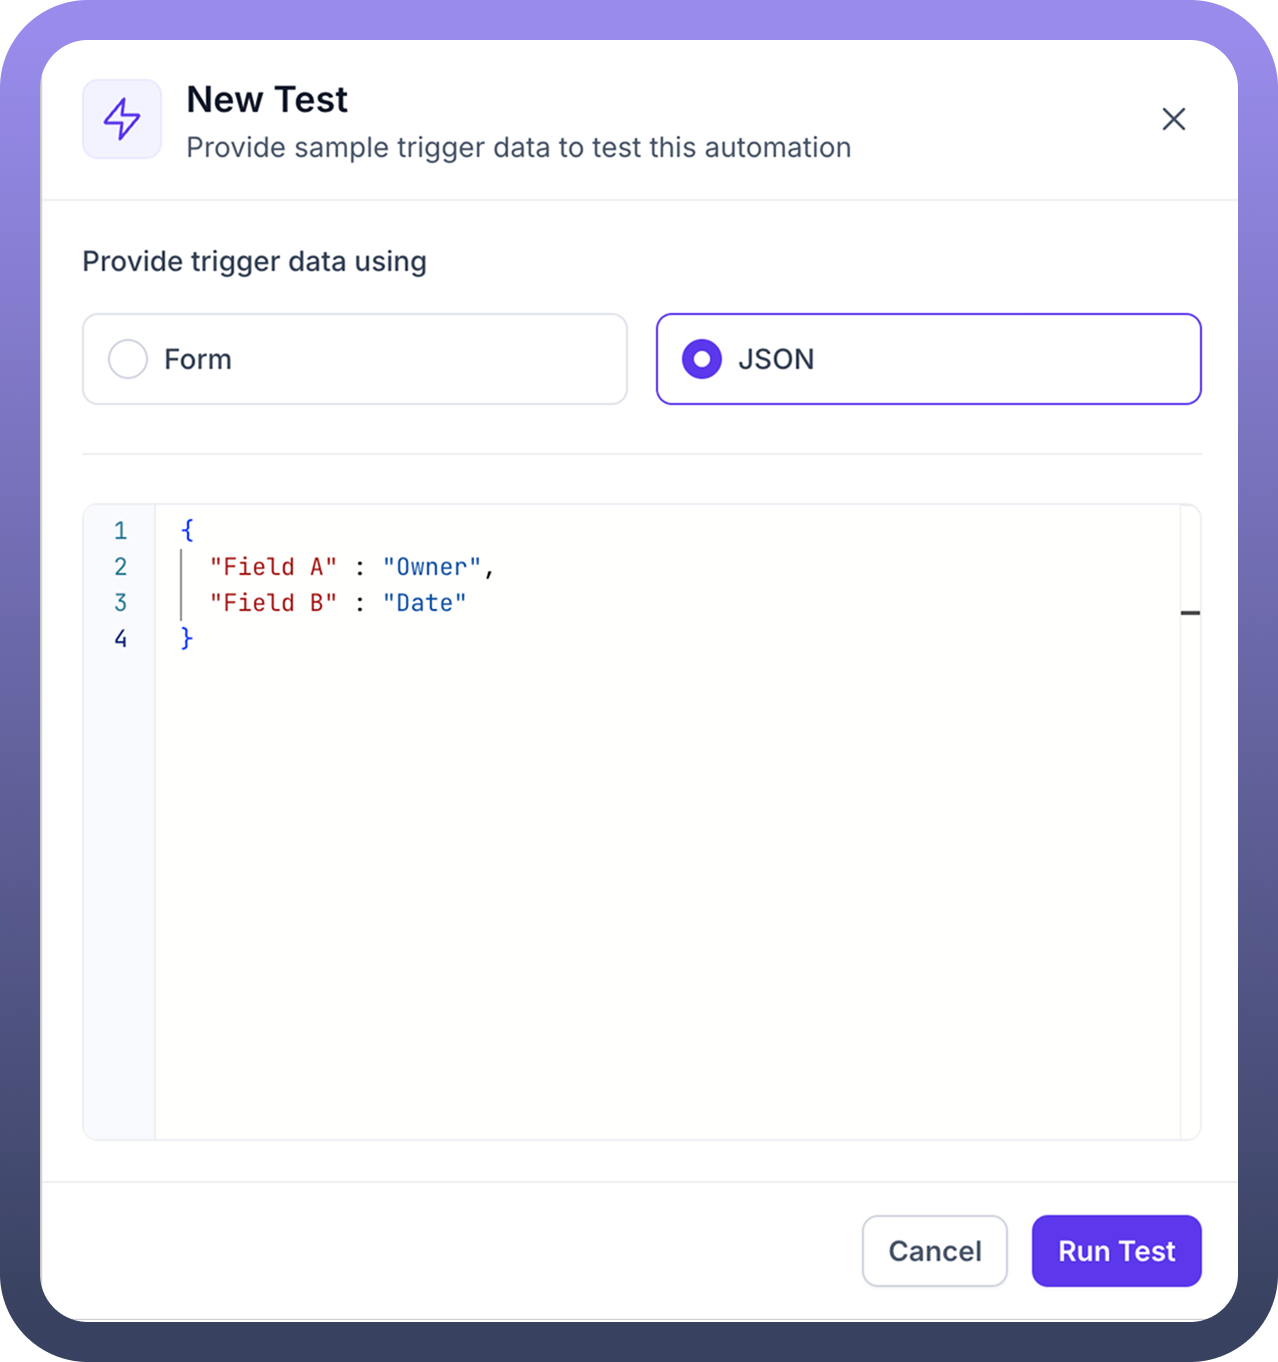
A dialog box will appear for entering the setup schema. You can choose one of the following options to input the data:
Form: Manually enter the data for the setup schema.JSON: Provide the setup data in JSON format.
Click the
Run Testbutton located at the bottom-right corner of the dialog box.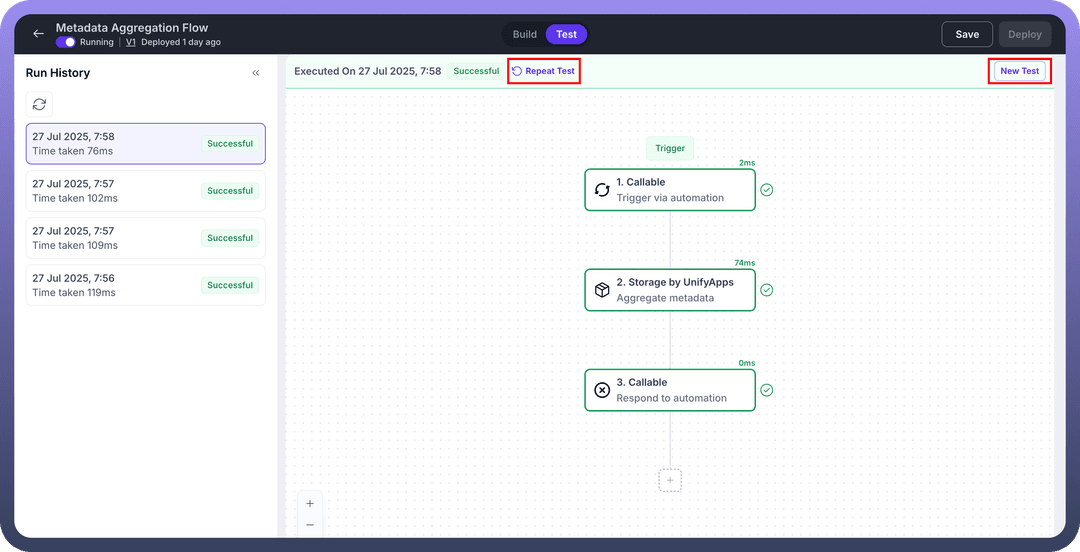
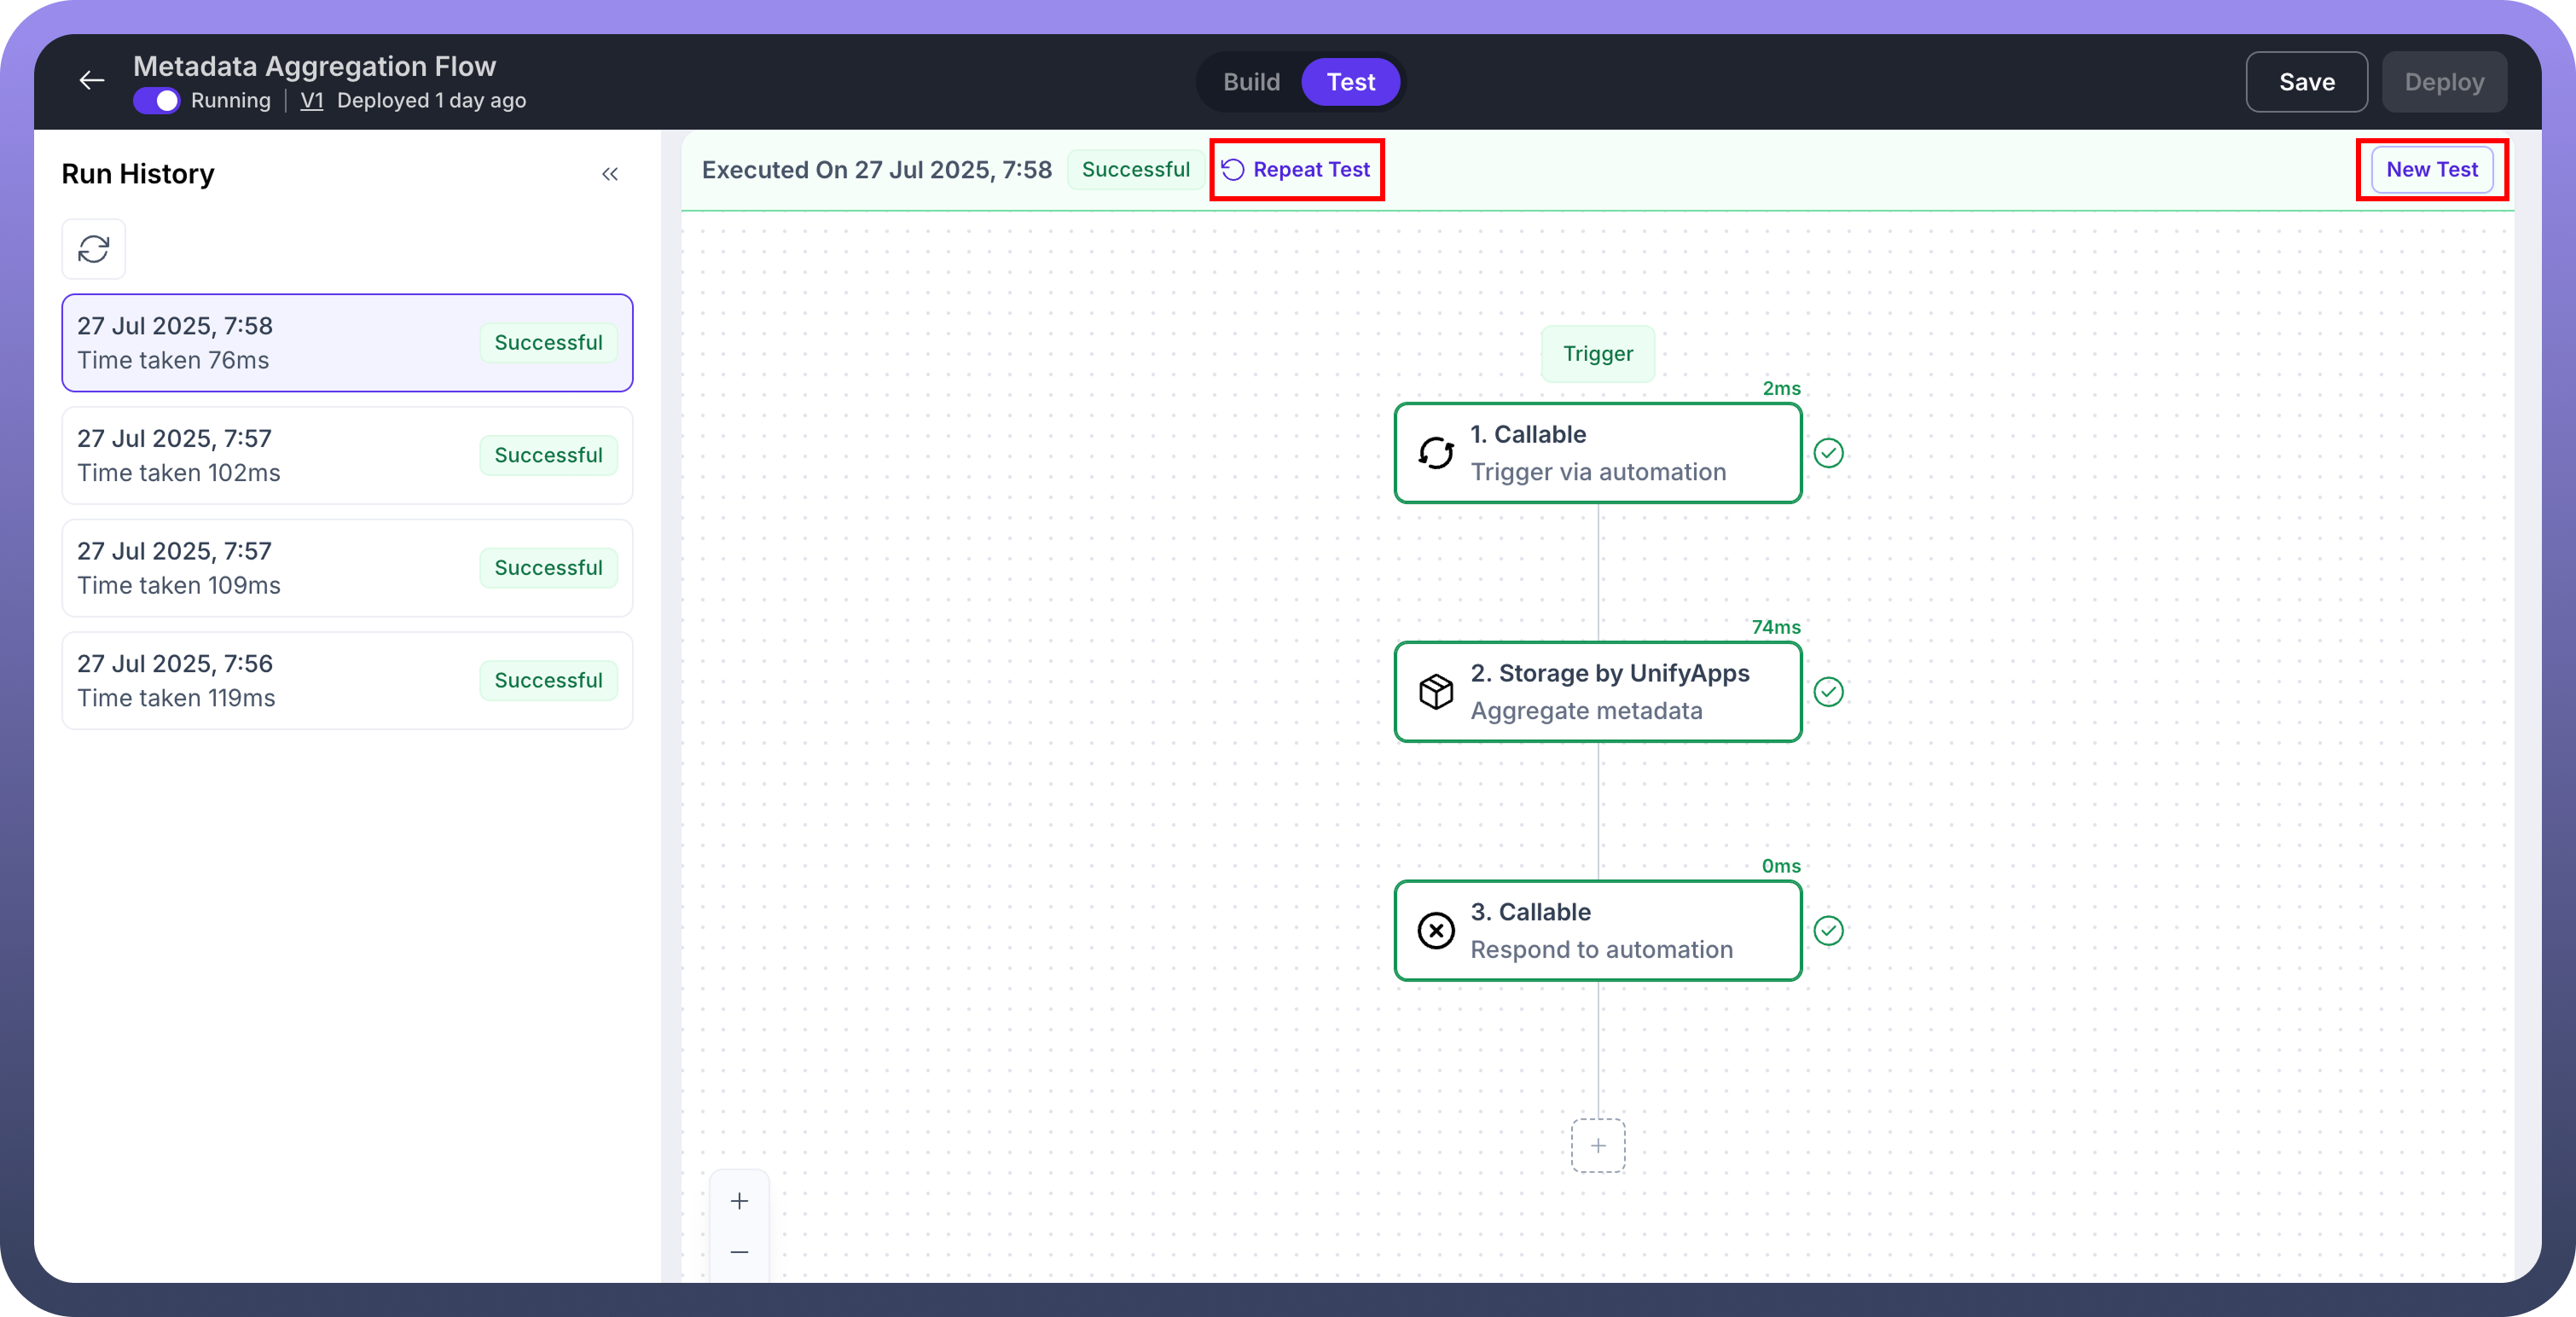
Click the
Repeat Testbutton to retest your automation using the same setup dataClick the
New Testbutton to retest your automation with different setup data.
→ If no setup schema is defined in the automation, the test will execute without it.
The Test Page
Run History
.png&w=1080&q=75) The Run History section is located on the left side of the test page, it displays:
The Run History section is located on the left side of the test page, it displays:.png)
A list of all tests performed on the automation so far.
Details for each test, including the execution date and time, the duration of the test, and a status tag indicating whether the test was successful, failed, canceled, etc.
The Automation
 At the center of the page, the automation version for the selected test is displayed.
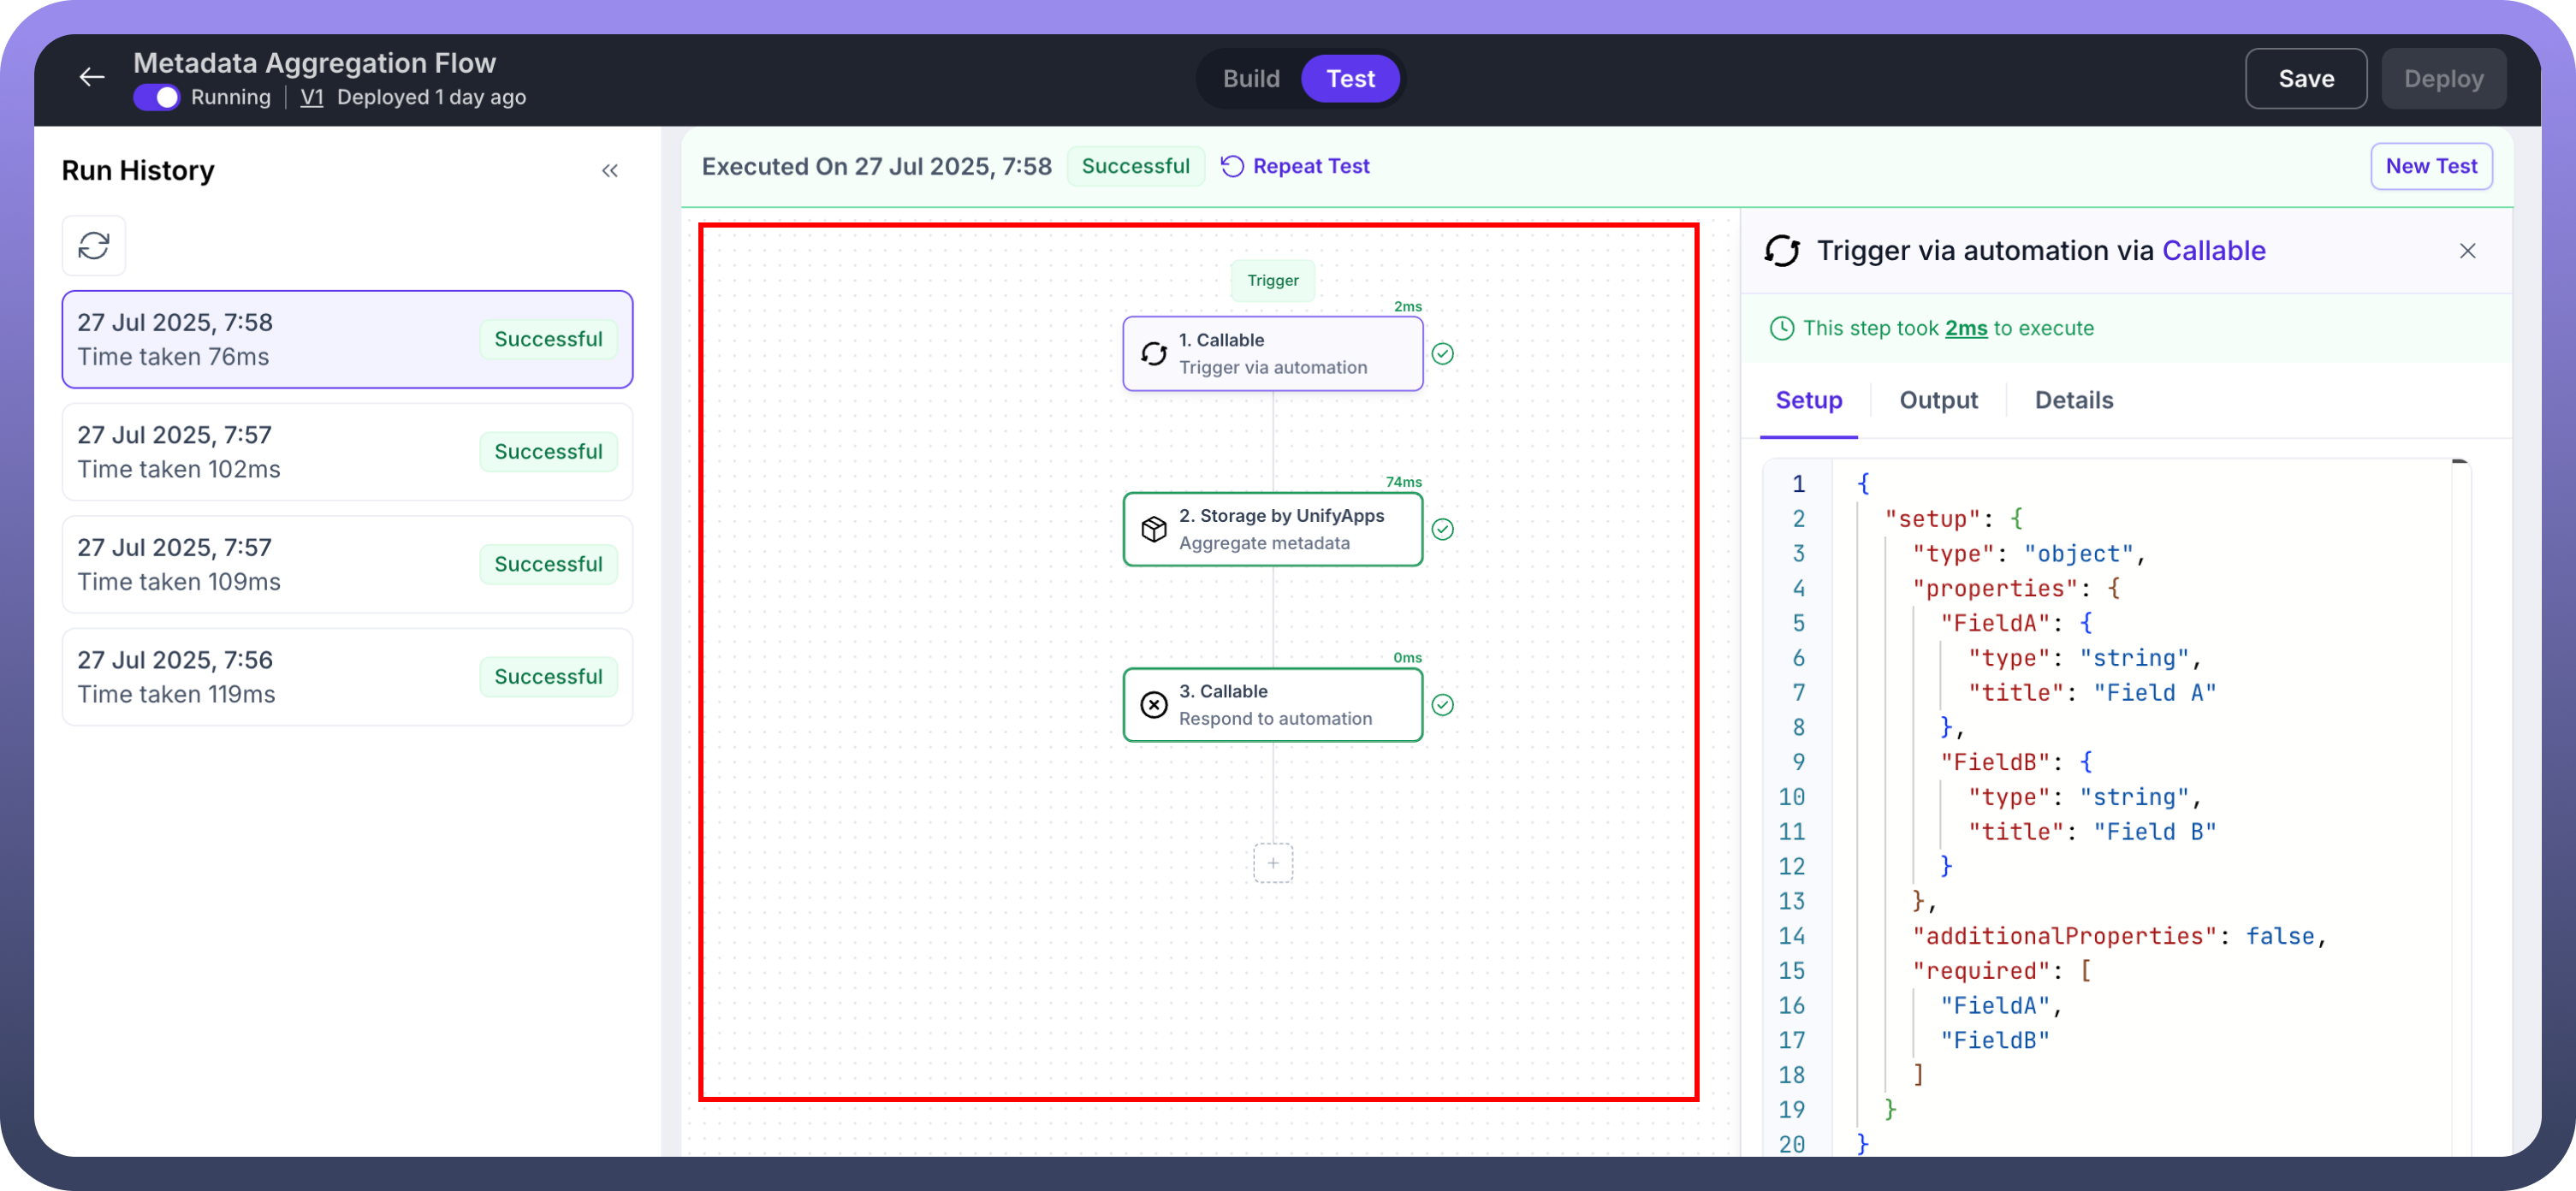
Each node includes the duration it took to execute during the test, shown at the top-right corner of the node.
The status of each node is also indicated:
A green outline means the test successfully passed through the node.
A red outline indicates an error with the node, with details about the error available in the Output tab.
The Input, Output and Details
 This section provides detailed information about the input, output, and details of the currently selected node.
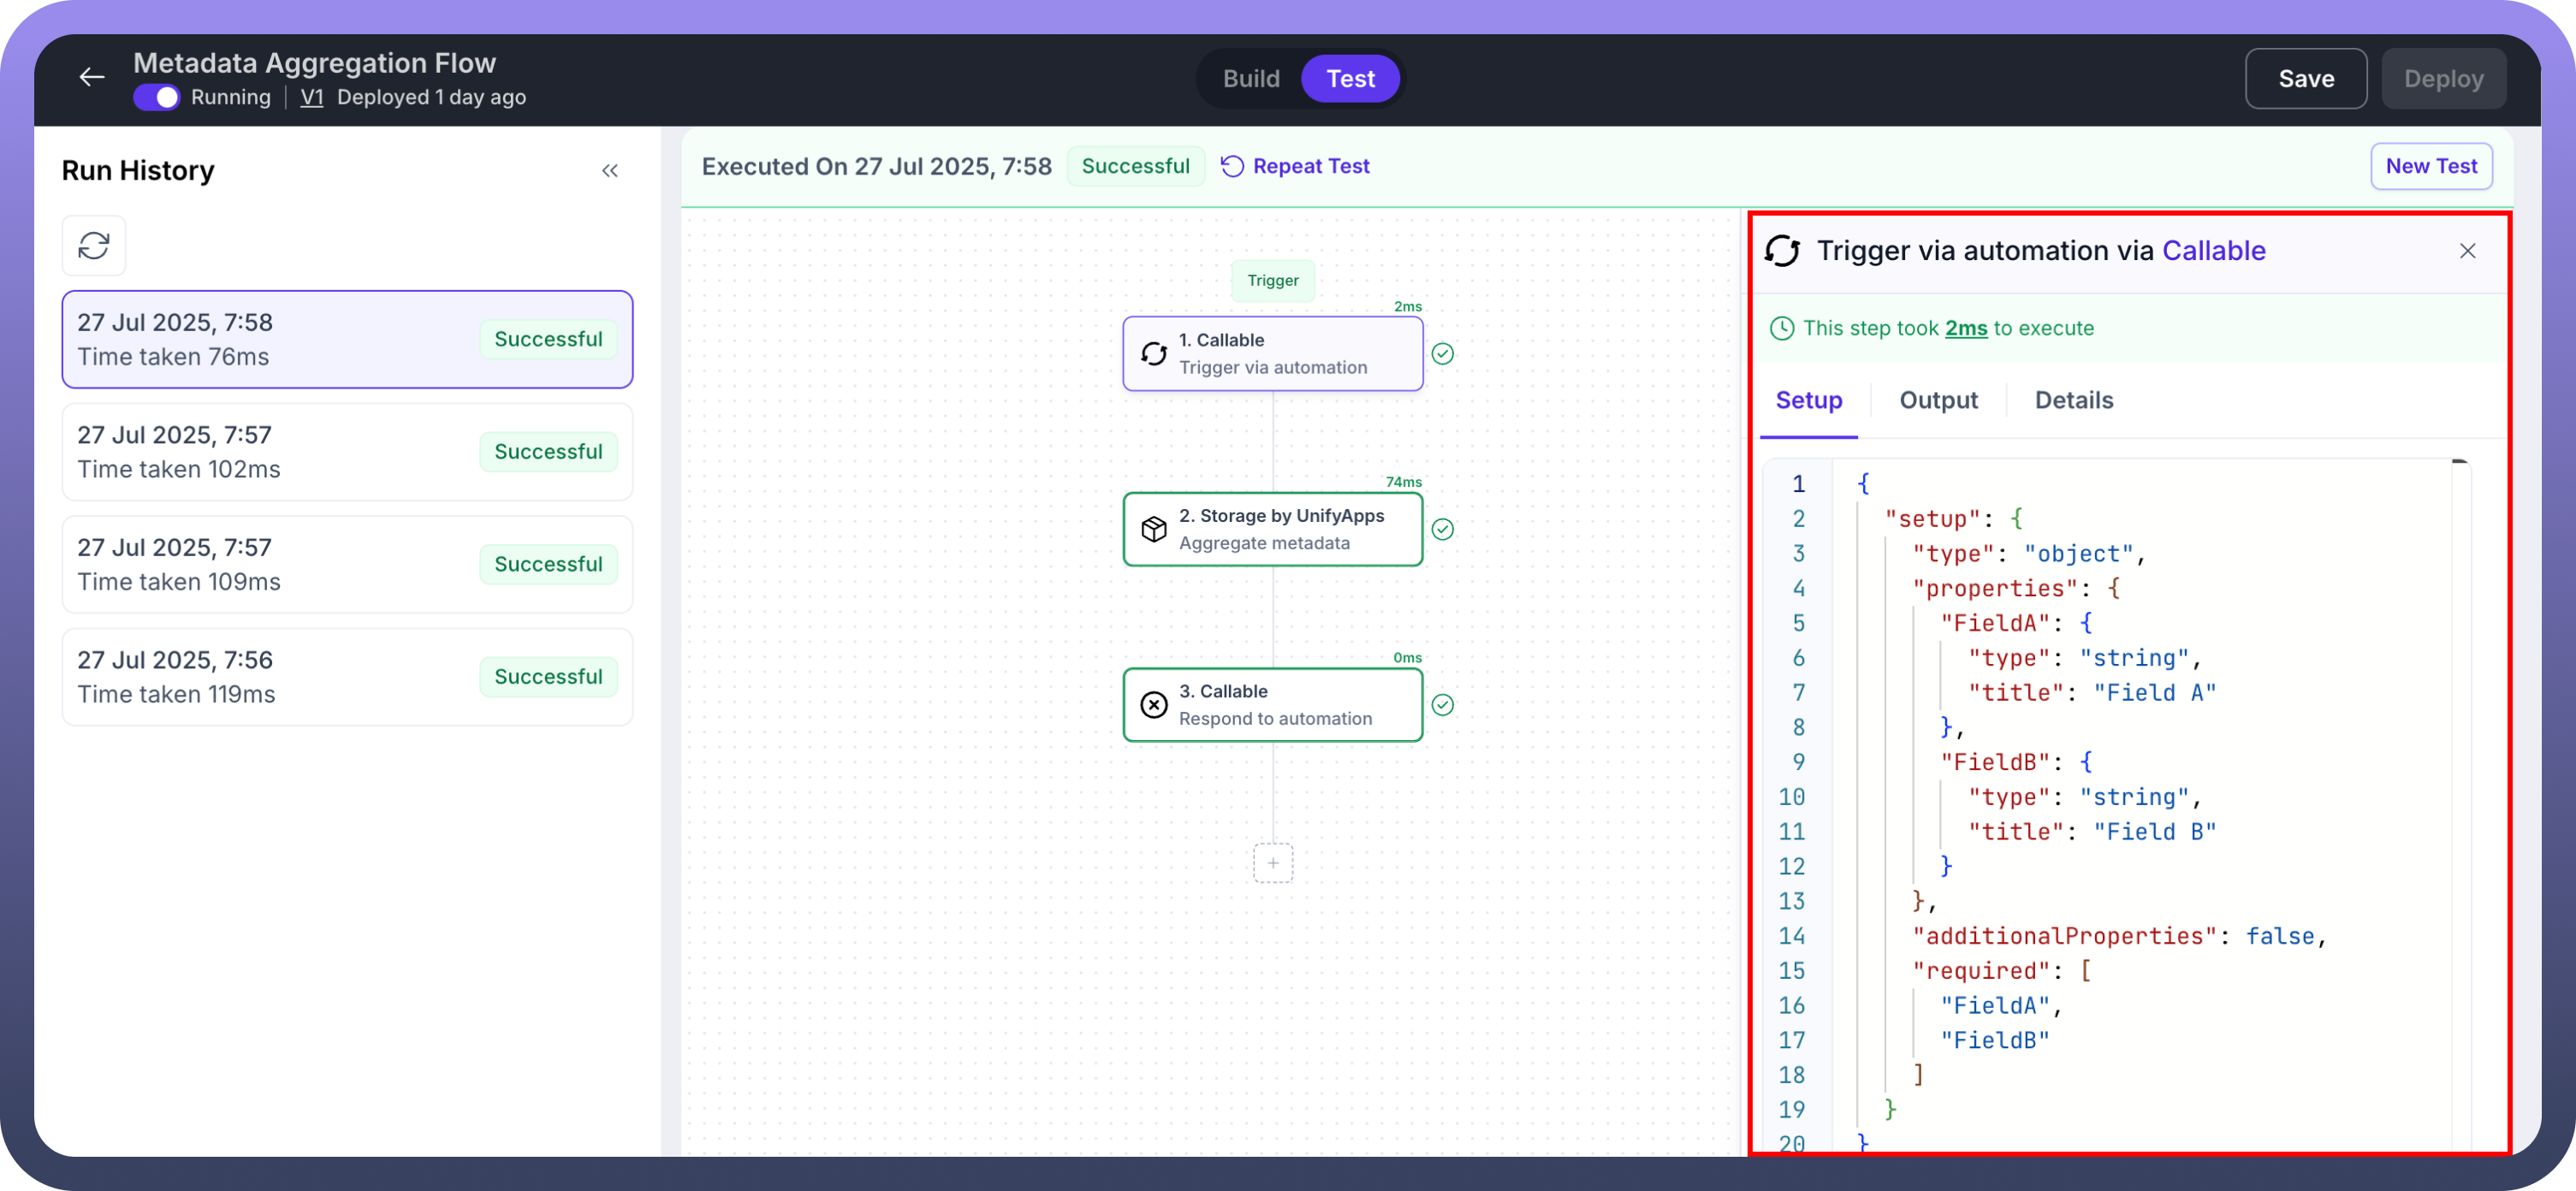
Input Tab
 Displays all the input data for the node, including their schemas, in JSON format.
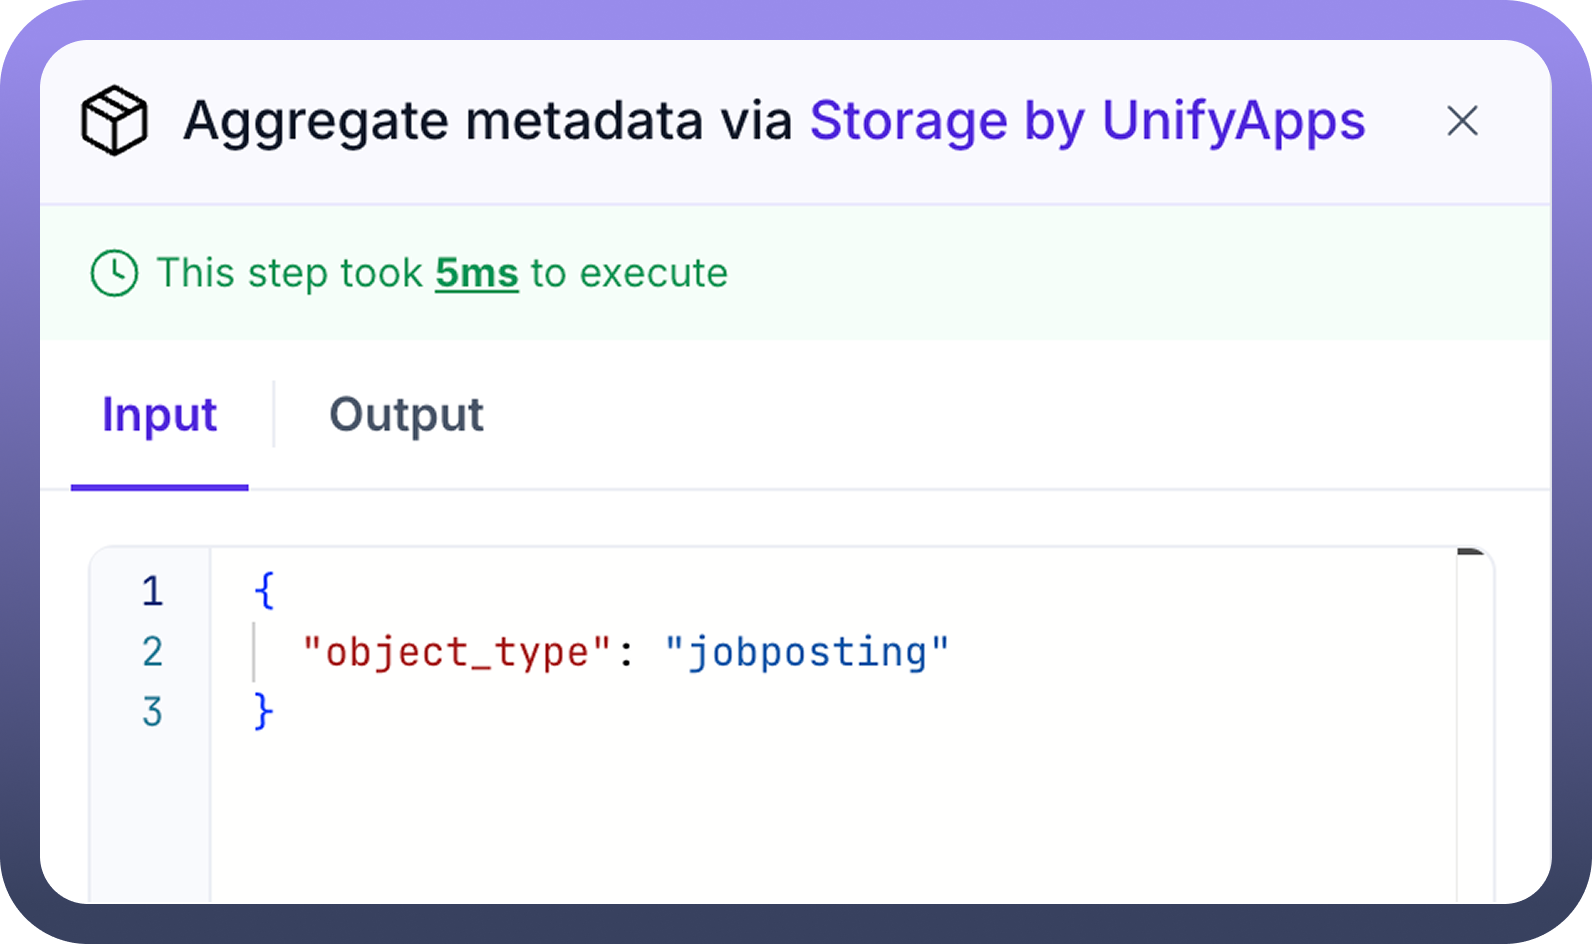
Output Tab
 Shows the expected output when the automation is tested.
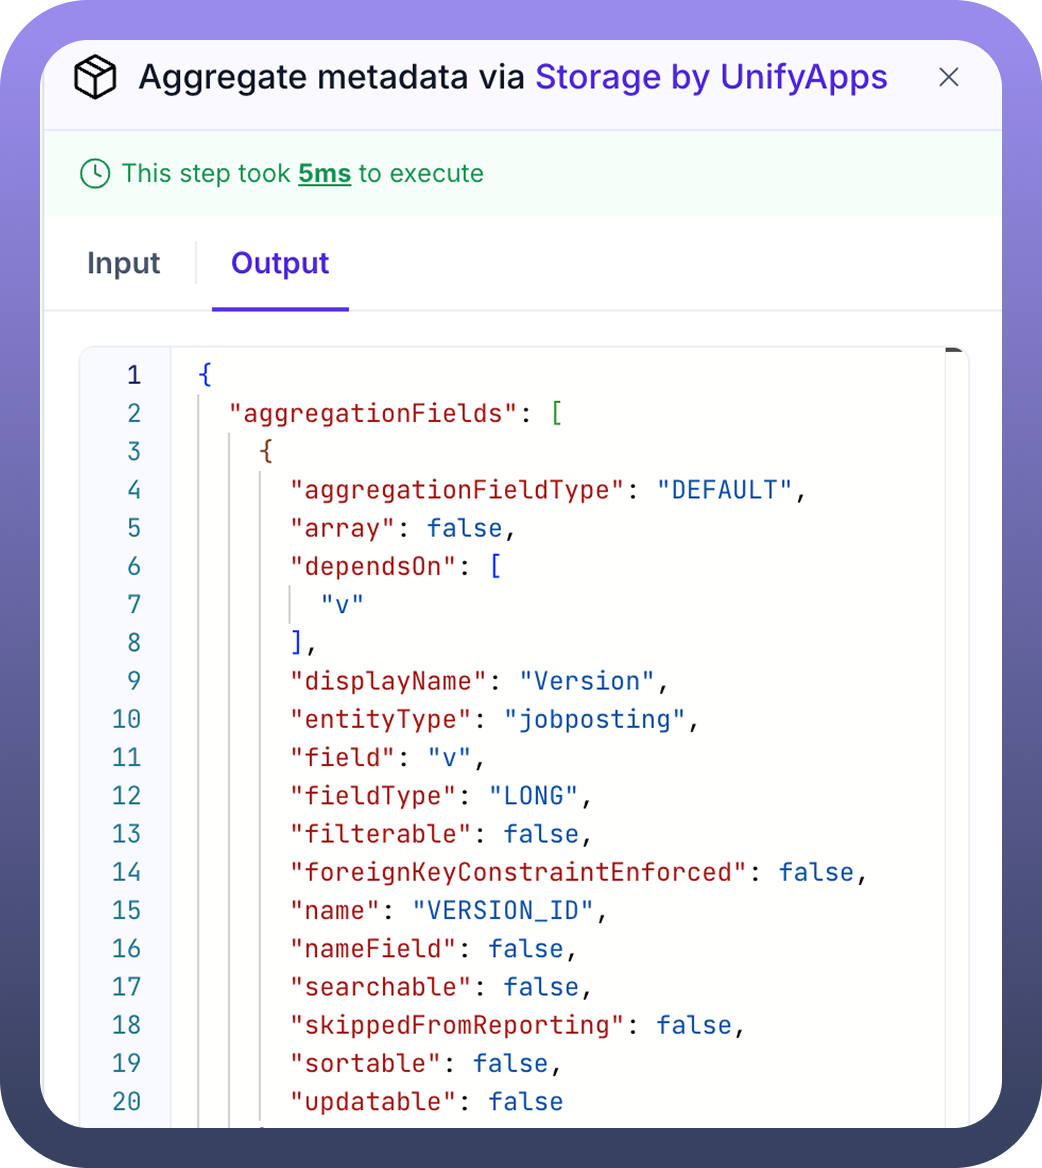
Details Tab
.png&w=1080&q=75) Highlights the App and Action associated with the selected node.
Highlights the App and Action associated with the selected node..png)
Error Tab
.png&w=1080&q=75) If the automation fails at the node, this tab provides details about the error.
If the automation fails at the node, this tab provides details about the error..png)